How To Gather Performance Data from Dev Tools in Beeper
Instructions
-
Enable Screen recording when the issue is visible on desktop app
-
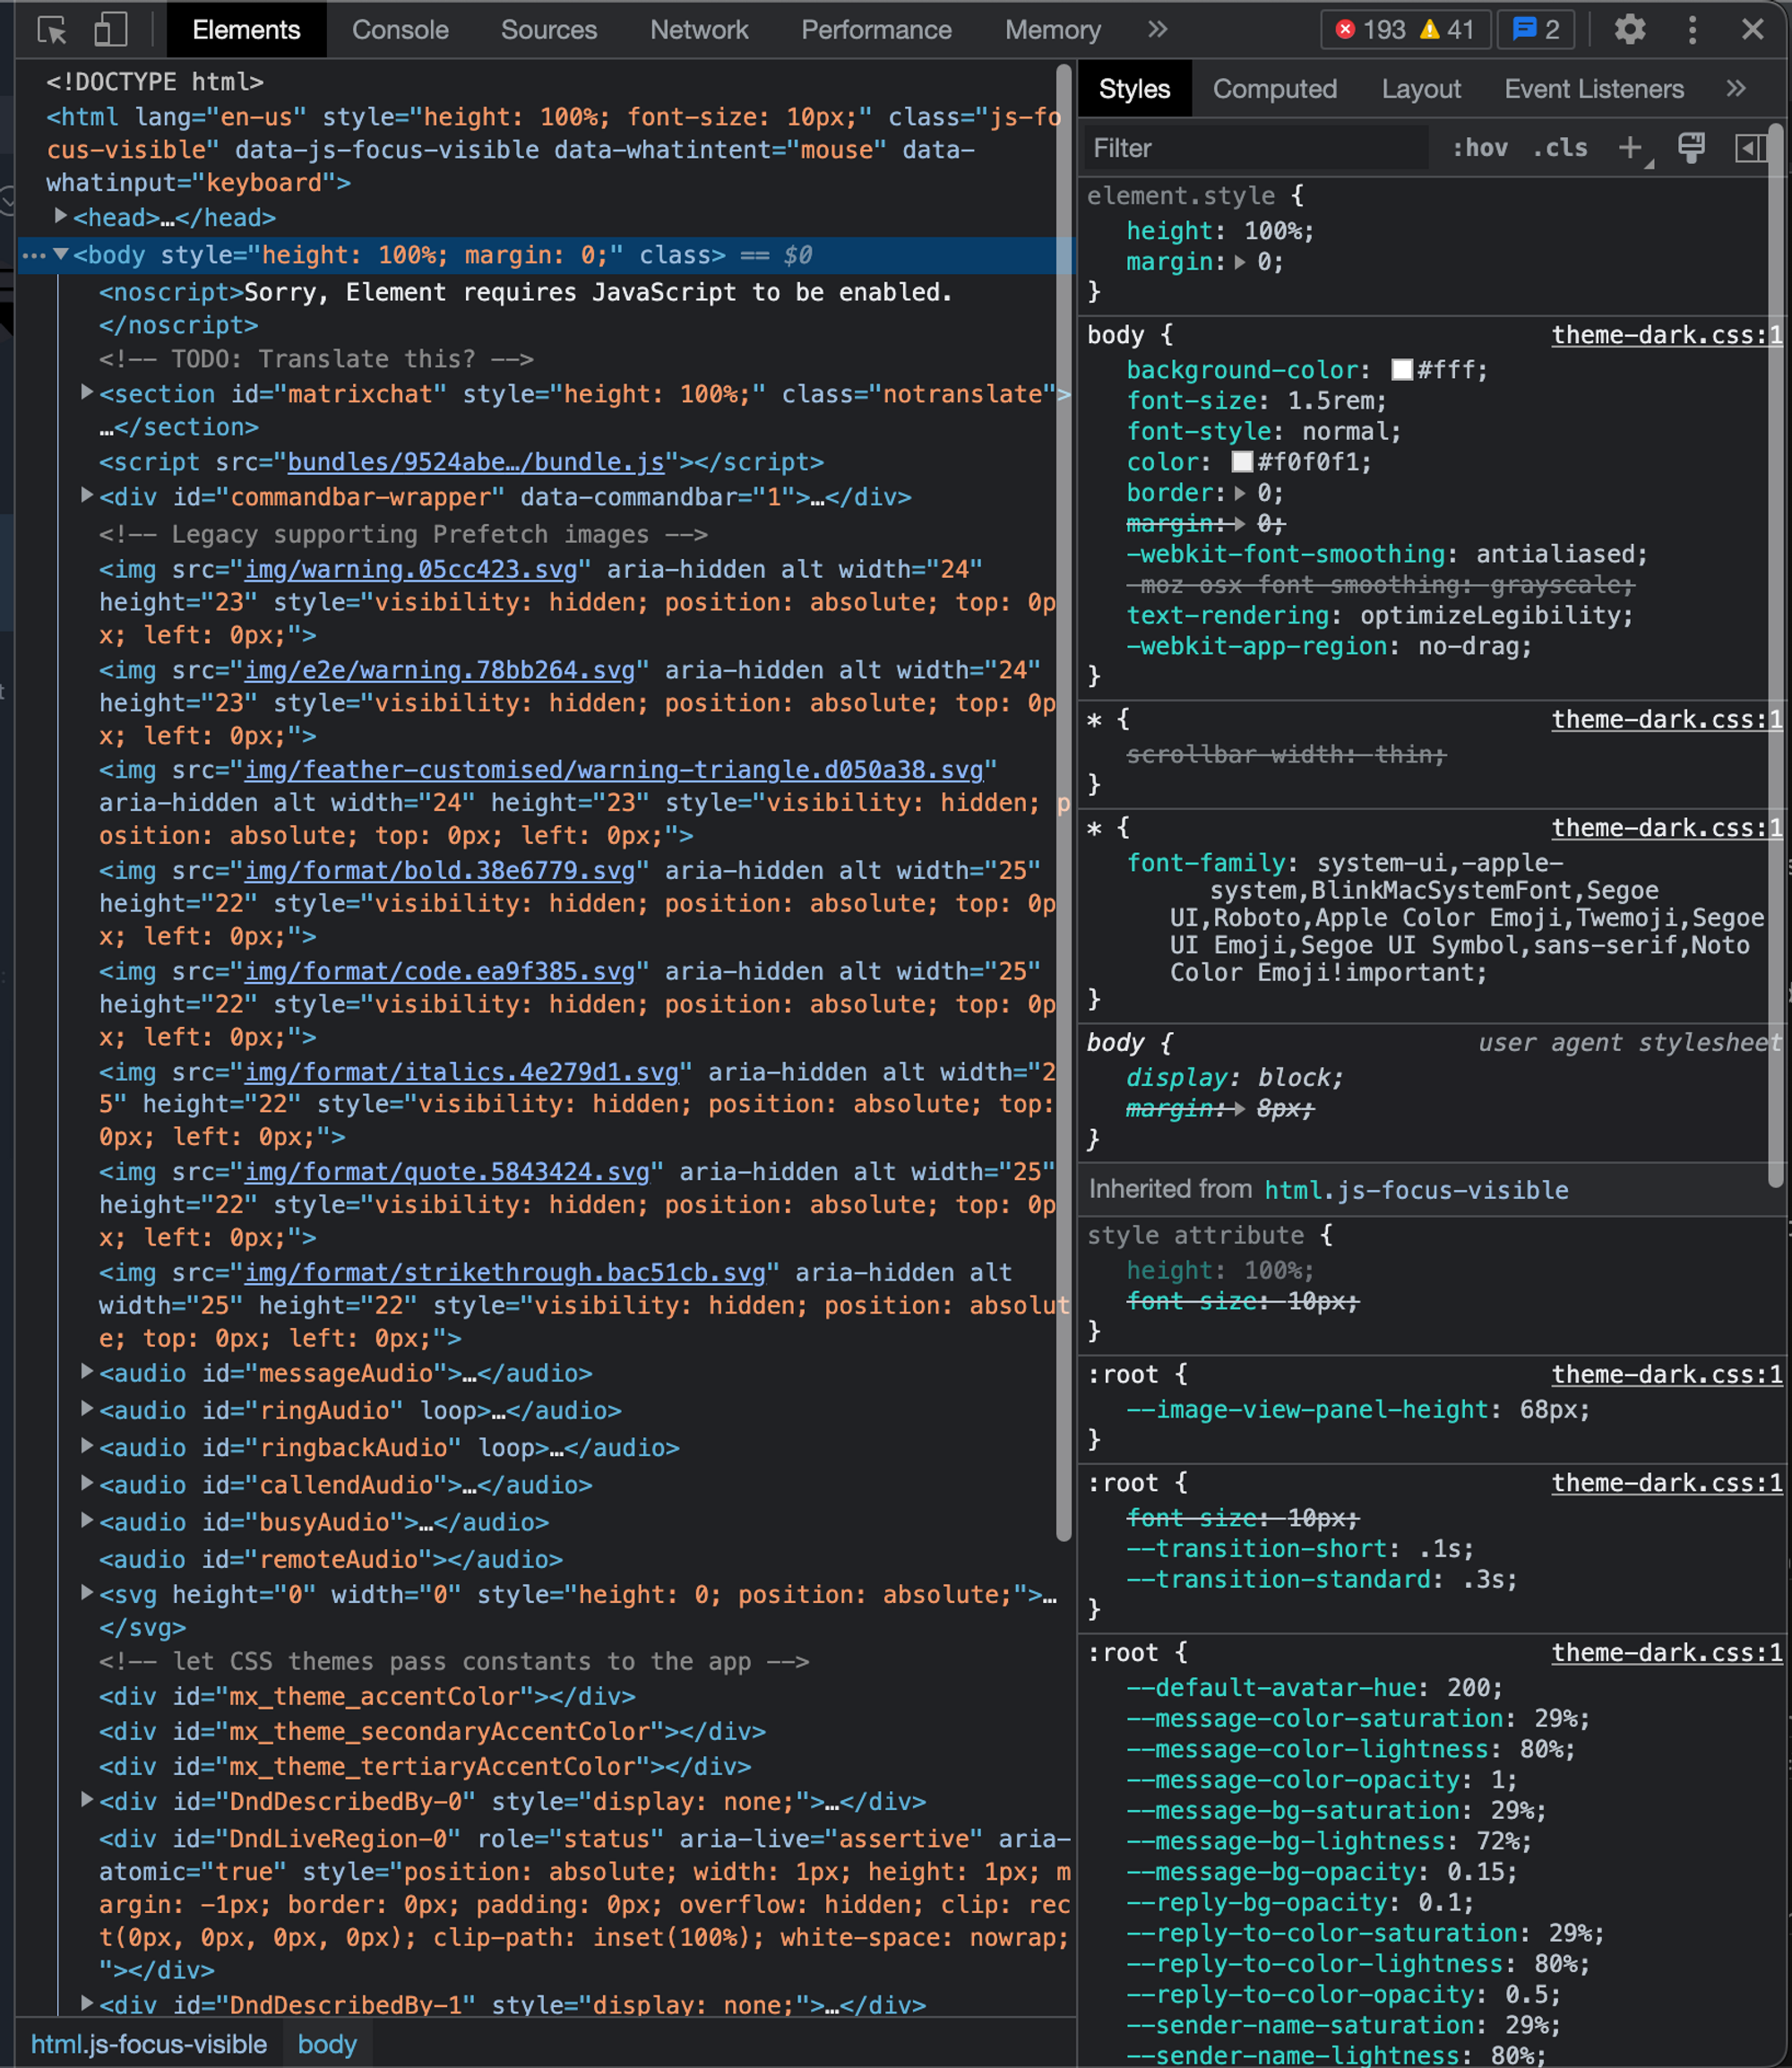
With the app active, on Windows: Ctrl+Shift+i or on Mac Cmd+Opt+i to bring up Dev Tools. Similar to Chrome’s Dev Tool, it looks like this:

-
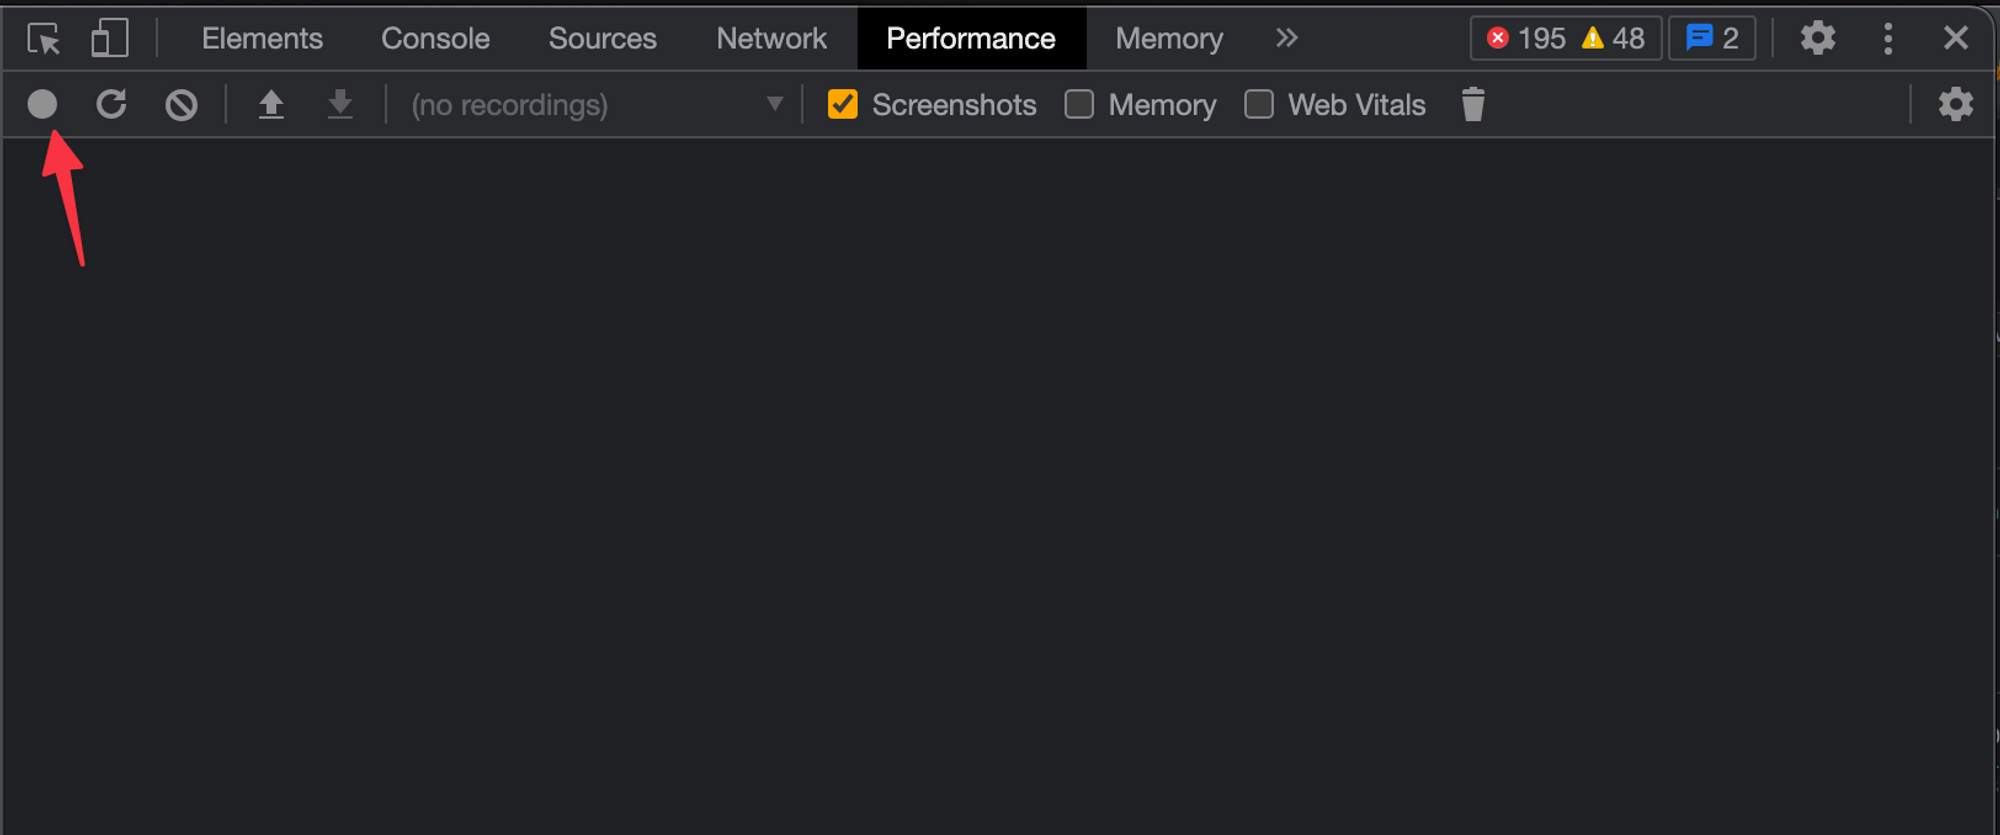
Select Performance

-
Click Record

- Perform the actions that you want to profile
-
Click Stop when you're finished

-
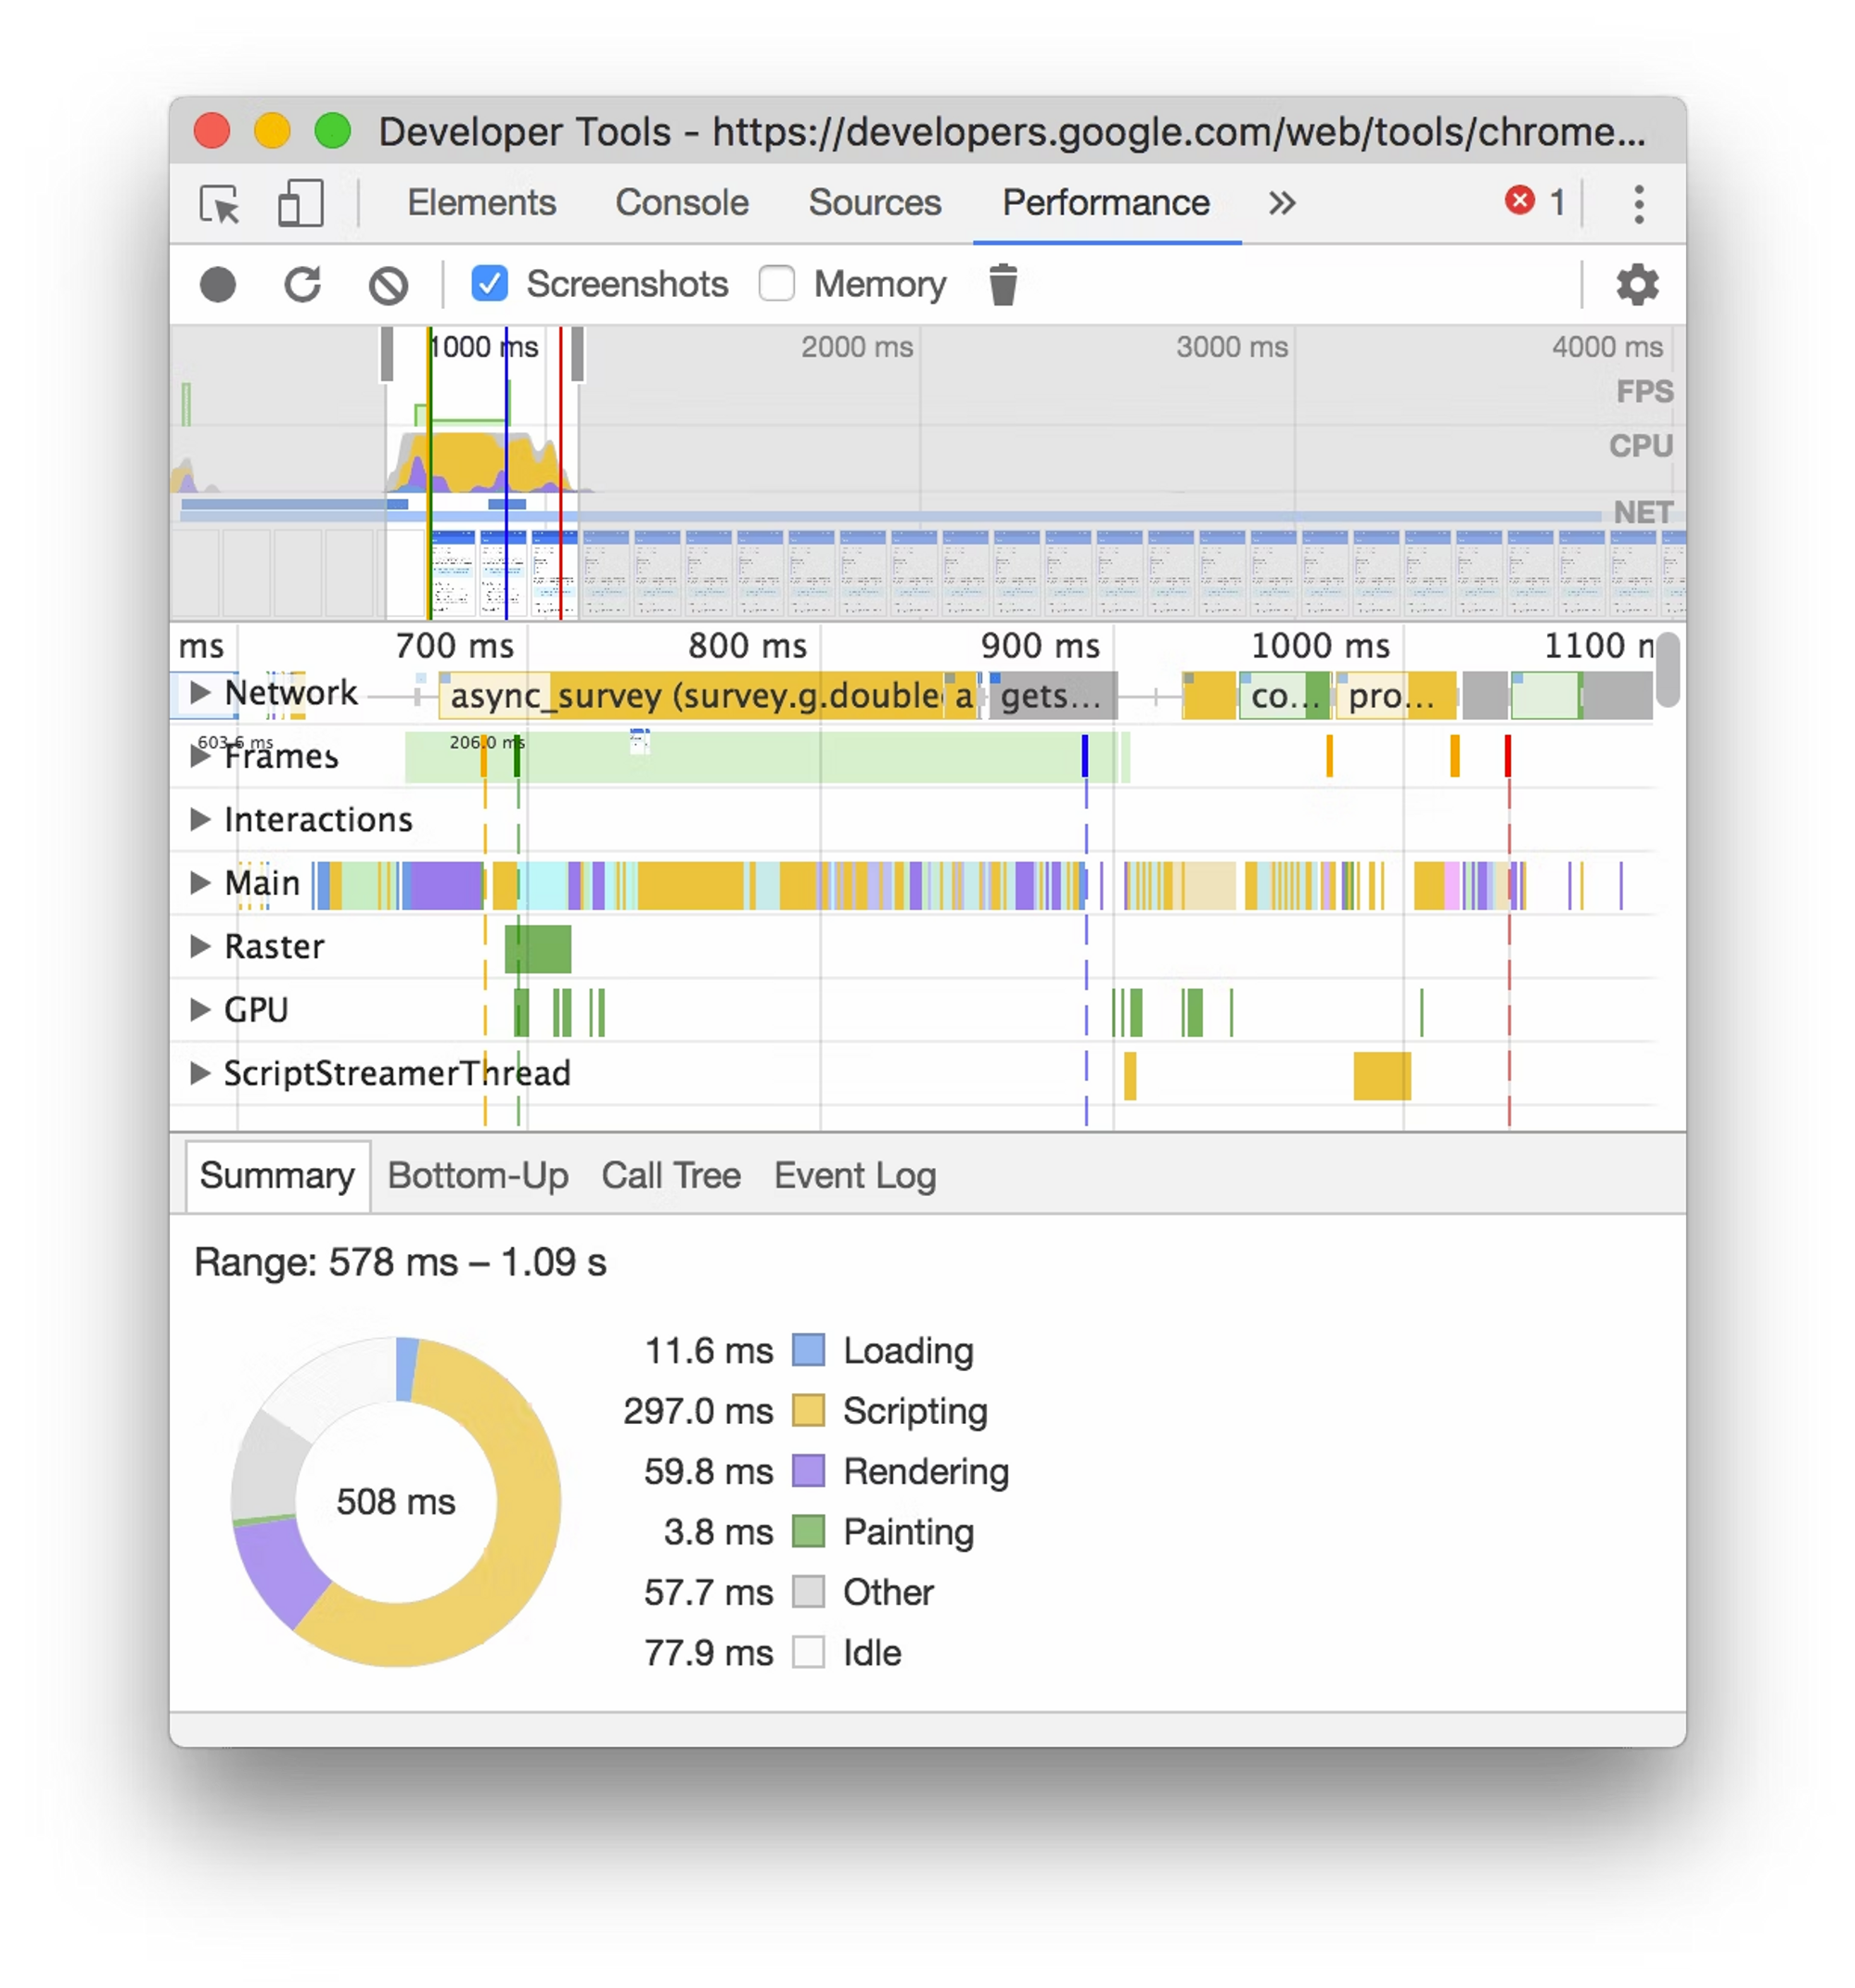
Wait for the profiler to finish processing. It will generate what is called a Workflow Map. Looks similar to this:

- Ensure that you capture the entire screen. If you need to scroll, that’s fine!
-
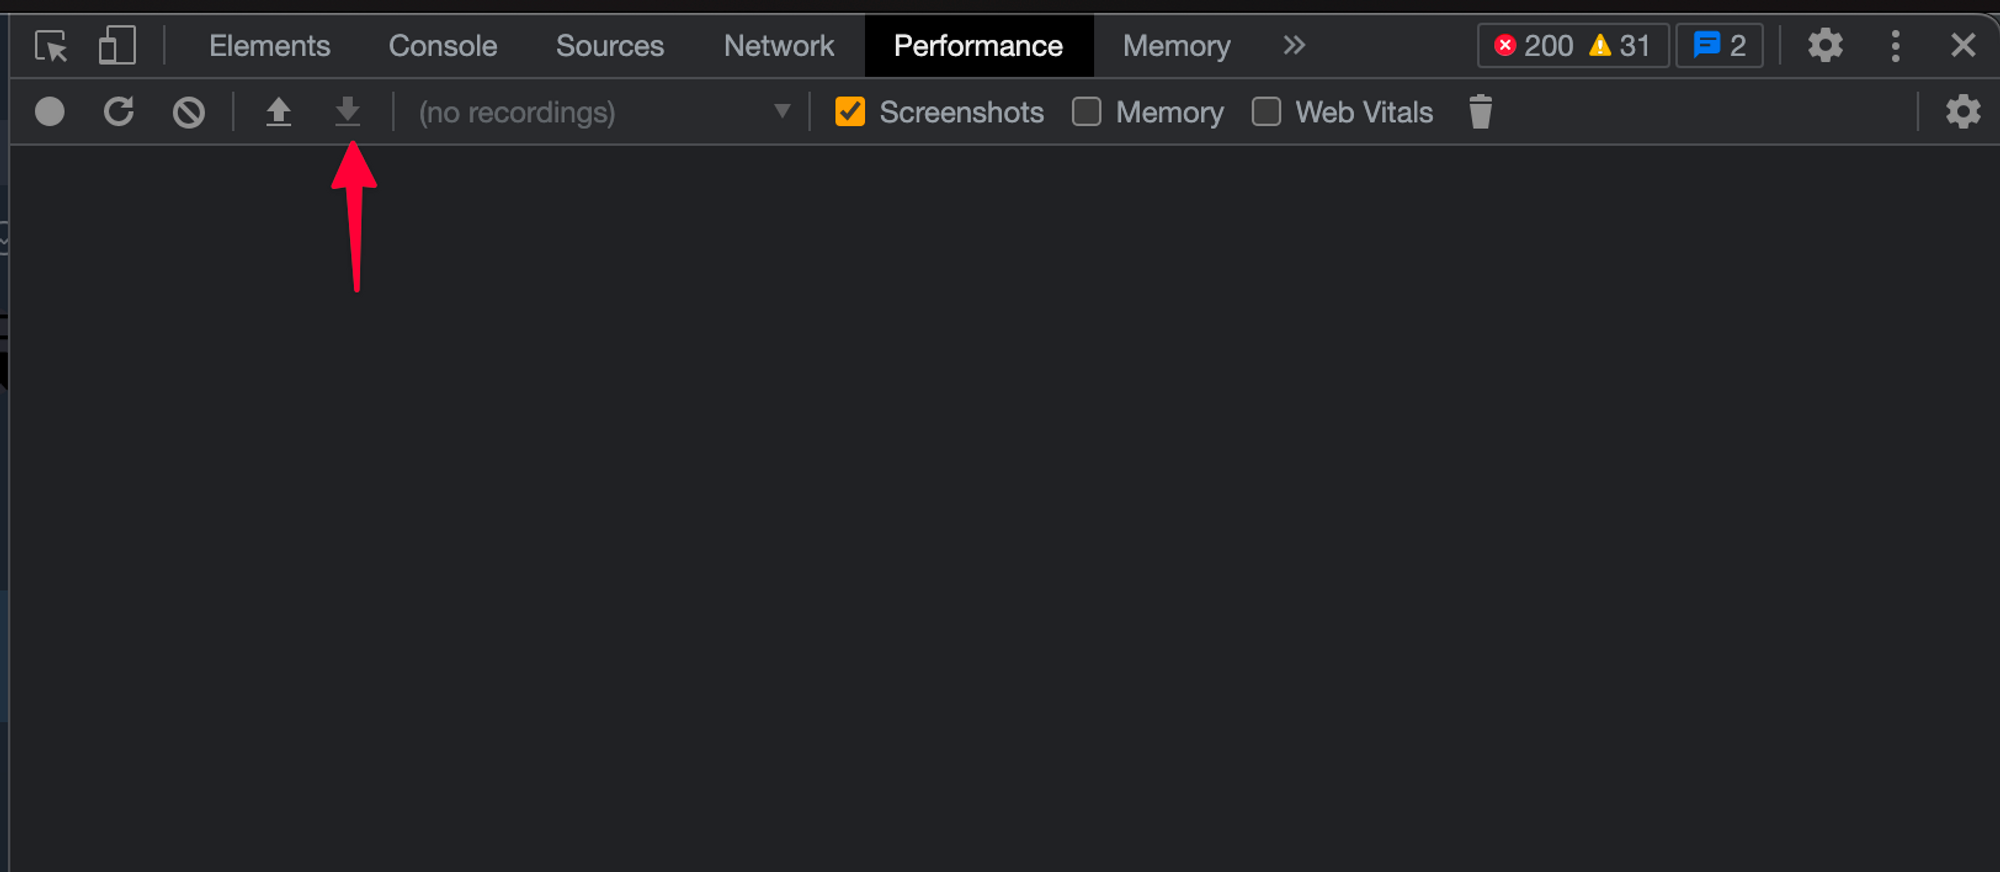
Select the download button to download the needed logs

-
With the app active, on Windows: Ctrl+Shift+i or on Mac Cmd+Opt+i to bring up Dev Tools. Similar to Chrome’s Dev Tool, it looks like this:
- Share to your support chat these things: a recording of the screen, saved screenshots, and logs.